How to read your solar payback numbers
This calculator answers one question — how long before the money you spent on solar comes back to you — and then three that follow from it: what a battery would add, what your spare power is worth, and whether paying by instalments helps. This guide explains what each input is doing behind the scenes, what every number on the results page means, and which ones are worth arguing with.
Every heading below links straight to the part of the calculator it describes, so you can read an explanation and look at the number side by side.
The numbers in the screenshots
Every figure on this page is a real screenshot of the real calculator, not a mock-up. The planning figures all use one US example so you can follow a single system from end to end: a home buying a 5 kW array for $13,500 that uses about 9,000 units a year and pays $0.15 a unit, selling spare power at $0.08, and funding it with 20% down over 240 months at 6.5%. Change any of those numbers and every figure here changes with them.
The numbers that have to be right
Open the inputsA payback period is one number divided by another: what you paid, divided by what the system earns you each year. The page will not show a headline until it has three figures — a size, a price and a cost — because anything less would be a number with a guess buried in the middle of it. It says which ones are missing rather than showing a provisional answer.
Two of those three have no acceptable default at all, and the fourth figure on the page — when you use your power — is the one most calculators bury. Between them they decide the answer to within several years.
| Field | Is it needed? | What happens if you leave it blank |
|---|---|---|
| 1 · System size (kW) | One of the three | Derived from your units a year at the average yield |
| 2 · Units you use a year | Optional | The page cannot tell you whether the size is bigger than your household can absorb |
| 3 · What the system costs | Needed | No answer. “See an illustrative estimate” offers a blended figure you have to accept before it is used |
| Price you pay per unit | Needed | No answer. There is no default, on purpose |
| When do you use power? | Needed — but it has our default | A default mixed answer is used, and the page says on the answer itself that it assumed it rather than being told |
| Units your system makes a year | Optional | Worked out from the size and a national average yield |
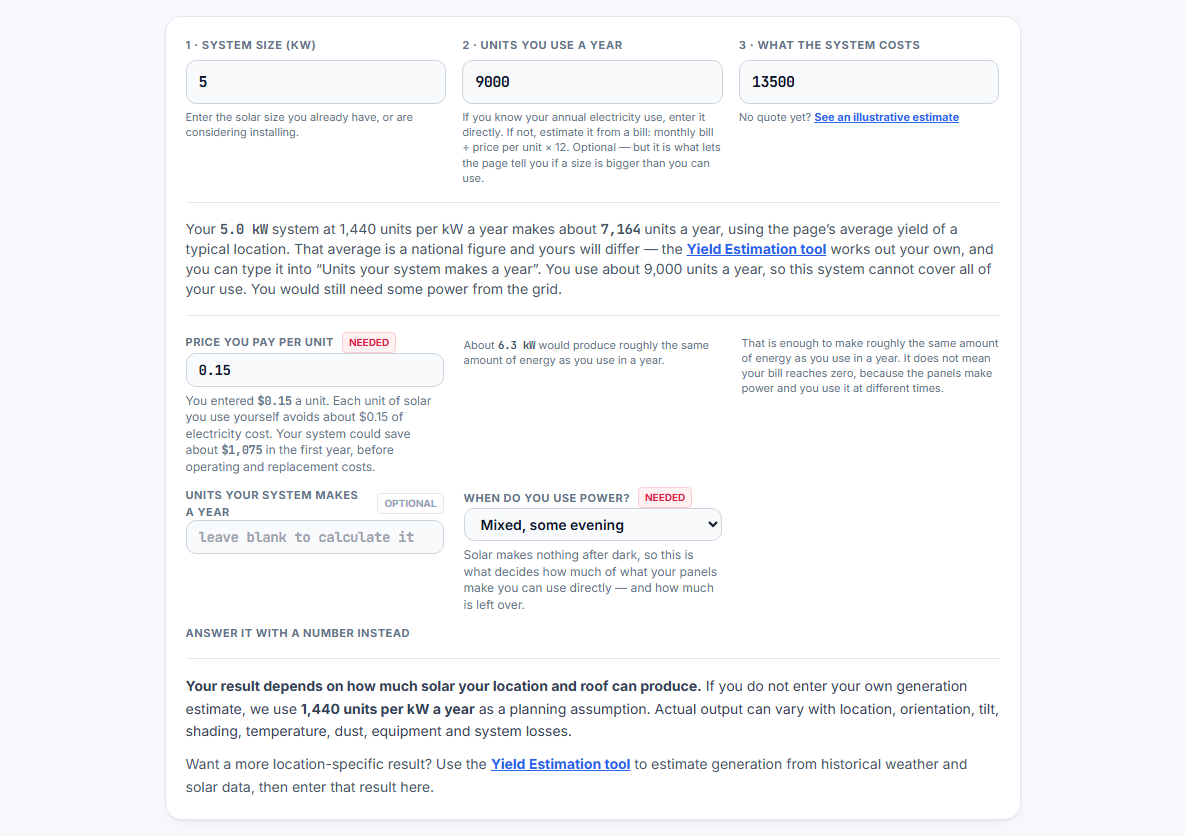
1. System size (kW)
Type it if you know what you have or what you have been quoted. Or leave it blank and enter the units you use, and the page works out the size that covers them at the average yield. Either way the size is on the page, and the note beside the inputs shows the multiplication behind it rather than just the answer.
2. Units you use a year
This is the optional field, and it does one job: it lets the page check the size you have chosen against a household that has to live with it. Divide a monthly bill by your unit price, then by twelve. Once it is in, the note tells you plainly whether the system makes more than you use or less — which is the difference between an array that mostly displaces your own purchases and one that mostly exports at a lower rate.
A 5 kW system at the page's average yield makes about 7,160 units a year. What you do with that depends almost entirely on how much you use, and on when. A household using 12,000 a year can use 6,450 of those units itself and has only 710 spare. A household using 3,000 can use 1,740 — its entire daytime demand — and is left with 5,420 a year it cannot use at any price, with the page saying so rather than leaving you to find out on the first export statement.
3. What the system costs
This is the numerator, and it is the single figure the answer is most sensitive to — not because of how it enters the arithmetic, but because of what the saving does not depend on. Your annual saving is set by the array and the tariff; the price only sets how long you wait for it. So halving the price exactly halves the payback, and a bad price cannot be offset by a good month.
If you have no quote, the page will show you a figure — but you have to accept it.
See an illustrative estimate offers a blended rate, and it is deliberately a two-step action: the first click shows you what the figure would be, the second accepts it. Nothing enters the calculation until you accept. While you have not, the cost field is left exactly as you typed it.
Two reasons for the extra click. The first is that our blended rate is an average across markets that genuinely differ by more than ten times, so it is useful for seeing the shape of an answer and close to useless as a specification. The second is that a figure we produced must never be mistaken for a figure you were given.
Once accepted, the estimate is labelled everywhere it appears: an amber note under the field, a tag on the cost tile, and a changed label on the card headed Take this to your installer — which also gains a line telling you not to show it to one. Type any real number over the top and all of it disappears, because it was never true about your quote.
Price you pay per unit
A capacity in kilowatts says nothing about what power is worth where you live, and the same 5 kW array means something very different in a country with cheap electricity than in one without. This is the one field with no default at all, and it is marked needed. The page used to fall back to a country figure read off a city lookup, which meant anyone who skipped it was quietly given a plausible-looking answer built on a price that was not theirs. Now it refuses instead. Every other money figure on the page is a multiple of this one, so if it is wrong everything is wrong — and the outputs look plausible either way.
The optional fifth box, and why it is worth using.
Next to the price per unit there is a field marked optional: units your system makes a year. Leave it blank and the page works generation out from the size and a national average. Fill it in — from an inverter display, a monitoring app, or a utility bill — and the page uses your number instead, and says so in the note beside it.
This matters because the average is an average for a whole country, and your roof is not an average. Real output moves with roof angle, shading, dust, the panels you bought and the year you are in; a good roof can run 15–20% above a national average and a shaded one can sit well below it. A number you have read off your own system is a better input than any average, so when you have one, the average is discarded rather than blended in. If the two disagree sharply the page says so and names the field, because one of the two is a typo.
A worked example. In Lahore a 1 kW array is usually quoted at about 1,620 units a year, which is 4.4 units a day. A household spending 50,000 Rs a month at 50 Rs a unit uses 1,000 units a month, or about 34 a day, so it needs roughly 34 ÷ 4.4 ≈ 7.5 kW. Enter 7.5 × 1,620 = 12,150 in the box and the page stops estimating. It will then reproduce the owner's own arithmetic almost exactly: 800,000 Rs against 12,150 units all used at 50 Rs works out at about 16 months, which is the figure they had calculated by hand.
Why the page does not ask where you are.
There is no city field. Sunlight is the largest physical variable in the calculation and it varies by about a factor of two across the globe, so a national average of 1,440 units per kW a year will be wrong somewhere — and the page says so in the note rather than dressing it up.
Two things replace it. The first is the units your system makes a year field described above, which is better than any lookup because it comes from your roof. The second is the Yield Estimation tool, which uses historical satellite and weather data rather than an average. Run it, type the answer into the box, and the average stops being used altogether.
Everything else — annual generation, degradation, cleaning, the inverter replacement — is either derived from those or held at a stated default. Those defaults are listed under How we worked this out.
The four things the calculator works out for you
See the implied system sizeYou are never asked for these, which is why the page is a short form rather than a long one:
- Annual generation = system size × units per kW a year, less first-year panel wear — or simply whatever you entered in the optional box
- System size = your capacity, or annual usage ÷ the average yield if you left it blank
- Annual usage = whatever you typed in units you use a year
- How much of what the panels make you can use yourself — worked out month by month from your answer to when do you use power
Without your units a year, the third of those falls back to the first.
A household cannot usefully displace more power in a year than the panels make, so when you have not said how much you use, the page uses the array's own output as the ceiling on what any sizing could achieve. That is a true upper bound rather than a guess in the optimistic direction, and it is why the page can still answer from nothing but a capacity, a cost and a unit rate.
What it loses is the check. With your units a year the page can say whether the size you have chosen is bigger than you can use; without one, the split between what you use and what you sell rests on your timing answer alone. The note under the inputs says so on the page rather than leaving you to assume it was verified.
All four give way to your own figures.
Enter units your system makes a year and generation is your number, not the band’s. Answer when do you use power and the split between what you use and what you sell comes from that instead of an assumption.
The saving is also capped at what you were actually buying. Generate 12,150 units a year against a 12,000-unit bill and the extra 150 are exported, not credited at the import rate — you cannot save money you never spent.
The array is sized to cover what you already use, and the page tells you the size it chose and invites you to change it. This is the same rule the System Size Calculator applies, so a system sized there lands on the same figure here.
When do you use power?
Answer itSolar makes nothing after dark. This question decides how much of what your panels make is worth the full price rather than the export price — and it changes the headline answer.
Three options, or type your own percentage:
| You answer | The page treats it as | So it assumes you use |
|---|---|---|
| Mostly daytime | 20% of your power after dark | 80% of it while the sun is up |
| Mixed, some evening (the default) | 42% after dark | 58% of it while the sun is up |
| Mostly evening and night | 70% after dark | 30% of it while the sun is up |
Same panels, same bill, six and a half years apart.
5 kW, 9,000 units a year, $13,500 of system, $0.15 a unit in, $0.08 out:
| You answer | Used directly | Left spare | Payback | Saves a month |
|---|---|---|---|---|
| Mostly daytime | 6,585 units (92%) | 579 | 16 years 1 month | $81 |
| Mixed | 5,200 units (73%) | 1,964 | 17 years 10 months | $72 |
| Mostly evening | 2,700 units (38%) | 4,464 | 22 years 8 months | $58 |
Nothing about the hardware changed. This used to be a single fixed 70% of generation, which moved only the battery half of the page when you changed your answer.
Why matching your annual use is not the same as a zero bill.
The page will tell you the size that would produce roughly as much energy as you use in a year. It is careful to add what that does not mean, because this is the easiest misreading on the whole page: a system can match your annual consumption and you will still buy power from the grid every month.
A kilowatt makes power at midday. You use power in the evening. Unless a battery moves the first to the second, the two never meet — and the bill only reaches zero on the days your household happens to be awake while the panels are working.
How the page uses your answer, month by month.
Each month the page asks how much of that month’s daylight demand the panels cover. What is left is spare power. What you use after dark is what a battery has to deliver into.
The months matter on their own. Output peaks mid-year and consumption peaks at the ends, so a low-sun month may not cover even your daytime use — and a surplus in June is not something you can spend in December. A single annual average cannot see that.
You will notice it when your numbers are close. A system making 12,150 units a year against a 12,000-unit bill sounds like it covers the lot; month by month it covers about 10,900, and the rest is bought back in the darker months.
If the three options do not fit, answer it with a number.
Under Answer it with a number instead is a field for the percentage of your power you use while the sun is up. Same question as the dropdown, not a second setting, and it overrides the dropdown when both are filled in.
The field's placeholder tells you what the dropdown currently implies, so you can see which one is in force. It reads dropdown says 58% until you type something, and then overriding: 90%.
Both ends of the range are real answers and both are accepted. Put 0 in if you use no power at all while the panels are working, and 100 if you use all of it then. The second of those is the only case in which the page will tell you your bill goes to nothing, and it says so carefully when it does — see what happens to your electricity bill.
The headline answer, and the four figures under it
Open the headline answer
“Your solar pays for itself in 18 years 5 months”
This is the year your cumulative savings first exceed what the system cost you. It is not the year the loan ends, and it is not the year the panels stop working — it is the month the spending stops outrunning the earning. It is calculated from the net cash flow after cleaning, repairs and one inverter replacement, not from a flat annual saving.
Two different 25-year numbers, and the difference between them is your money.
The tiles read Profit after payback and 25-year total benefit, and they are not the same figure:
- Profit after payback ($5,067 here) is what the system earns after the original $13,500 has come back to you. Because payback is the point at which everything earned so far has exactly covered what you spent, every unit after that moment is profit.
- 25-year total benefit ($18,567 here) is the whole 25 years of benefit, including the part that repaid the system. It is the larger number because it contains the $13,500 you got back.
$18,567 − $13,500 = $5,067. Neither number is wrong; quoting one without saying which it is was the problem, and the page used to label a single figure “net worth after 25 years”, which described neither. The sentence under the tiles now states the relationship in words, and What the 25-year figure includes opens to show the five assumptions behind it — panel wear, running costs, the inverter, held-flat prices, and where the generation figure came from. A 25-year number means nothing until you know what was held constant across those 25 years.
The number people misread most: units per kW is not units per system.
The page works from a per kilowatt figure, and it says so: “1,440 units per kW a year.” That is what one kilowatt makes in a year, not what your whole installation makes — so on a 7 kW roof it is about 10,100 units a year, not 1,440.
This is why the note under the inputs shows the multiplication rather than just the answer: 7.5 kW × 1,440 units per kW a year = about 10,700 units a year. If a payback looks impossible, check that line first. The system size and the units a year are the two numbers that decide whether the saving can beat the price, and both are shown.
1,440 is a national average, and the page says so rather than implying it knows where you are. It does not quietly substitute a sunnier figure either, which would flatter every saving for anyone who did not correct it. Two things replace it: your own measured output, or a figure from the Yield Estimation tool.
| Figure | How to read it |
|---|---|
| It costs you | The system price. The anchor: every other number is a return on this, and the annual saving does not depend on it at all — so halving the price exactly halves the payback. It is the figure to argue with, and the one a competing quote changes most. If you accepted an illustrative estimate rather than a real quote, the tile is tagged and the card you hand an installer says so. |
| Saves you each month | Year-one net saving divided by twelve. Already has cleaning, repairs and export credit inside it. Compare it against the EMI in section 10 — the two numbers answer the affordability question directly. It is a year-one figure, so it falls as the panels wear; the loan section accounts for that. |
| Profit after payback | What the system earns in the 25 years after the original cost has come back. Everything the panels make from the payback month onwards. This is the “better off than doing nothing” figure. |
| 25-year total benefit | The whole 25 years, including the part that repaid the system. It is larger than the tile beside it by exactly the amount you paid up front. Use this one to answer “how much does 25 years of this be worth”; use the other to answer “what did I end up on”. |
Generation — units the system makes a year — is no longer a tile of its own. It is printed in full in the note under the inputs, as the multiplication rather than a bare number: 5 kW × 1,440 units per kW a year = about 7,164 units a year. That note also compares it against the units you said you use, so you can see at a glance whether the array is larger than your household can absorb.
If the headline says the system does not pay back in 25 years, the calculator will not dress that up. The line below simply never reaches zero, and the page says which two figures would move it.
What happens to your electricity bill
Open the bill comparisonTwo bars and a percentage: the bill you pay now, the bill you would pay, and the drop between them. This is usually the most persuasive number on the page, because it is the only one expressed in the unit your household actually experiences.

When the badge says “Daytime import falls” instead of “Your bill falls”
A 100% drop is arithmetically possible and practically misleading. Solar makes nothing after dark, so the figure counts only the power the panels cover while the sun is up. You still buy your night-time electricity at full price unless a battery stores the surplus. Whenever the daytime drop is total, the page switches the wording and shows this note rather than claiming your bill has gone.
The note under the bars separates three things that are easy to merge in your head: the drop on the bill itself, the credit for power you sell, and the running costs that come back out. “What you keep each month” is the first minus the third, and that is the same figure as “Saves you each month” above.
The 25-year line and the year-by-year table
Open the 25-year lineThe line is your cumulative position: everything you have saved minus everything the system has cost you. It starts below zero, because you pay before the panels earn, and it crosses the dashed zero line at your payback point.
What a single payback number cannot tell you, and the shape does:
- How deep the hole gets. The lowest point is the worst your finances will be while you wait. On a typical system it is somewhere in year three or four.
- There is a small step down around year 12. That is the inverter replacement, not an error. Inverters wear out well before the panels do.
- The line is slightly jagged, not smooth. Panel wear compounds a little differently each year.
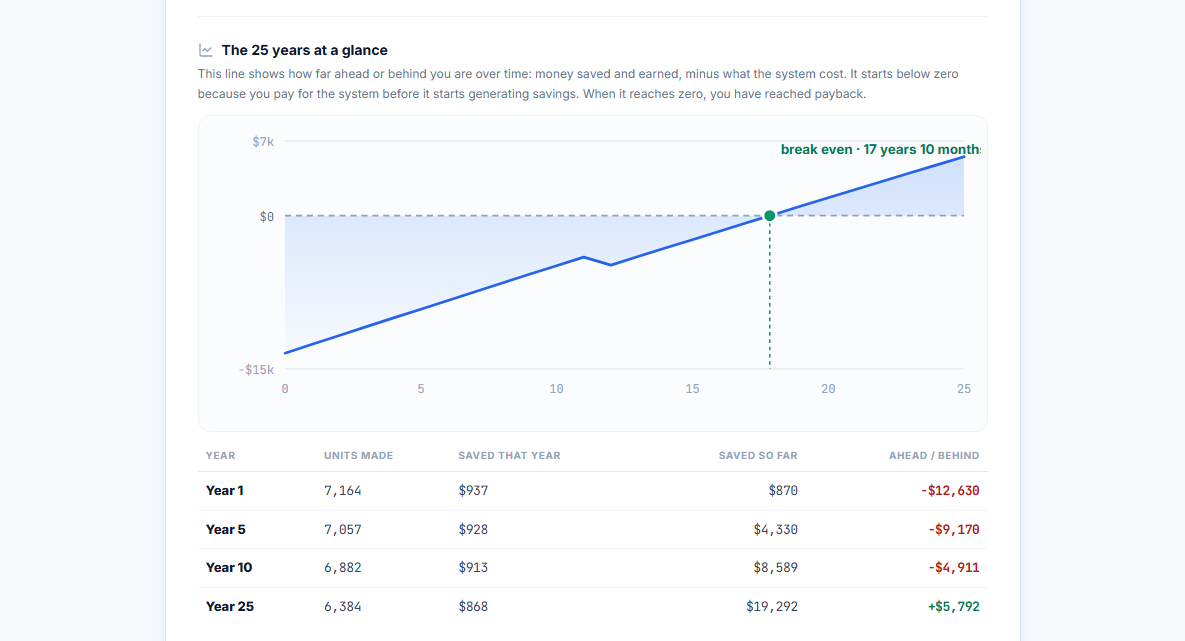
Nothing in that table is a forecast of future prices — the calculator holds electricity prices flat unless you tell it otherwise, so the only thing growing in the right-hand columns is your own generation slowly wearing out.
25 years with solar, and without it
Open the comparisonThis is the question the whole tool is really about. Left: what 25 years of your electricity would cost with no solar. Middle: what the same 25 years cost with solar, including the system price and its running costs. Right: the difference.
No discount rate is applied to either side, because every unit of money is compared with another unit of money at the same time. If you want to see what rising prices would do, the escalation setting is under Tell us more — and it is set to zero by default, because a payback period should not depend on a guess about the future.
“What if I have this wrong?”
Open the cardsEvery calculator rests on estimates. These cards take the figures most likely to be wrong, change one at a time, and show how far the payback moves. The first card is your answer as entered; the other three ask what it would become if one of your own numbers turned out to be the thing you got wrong.
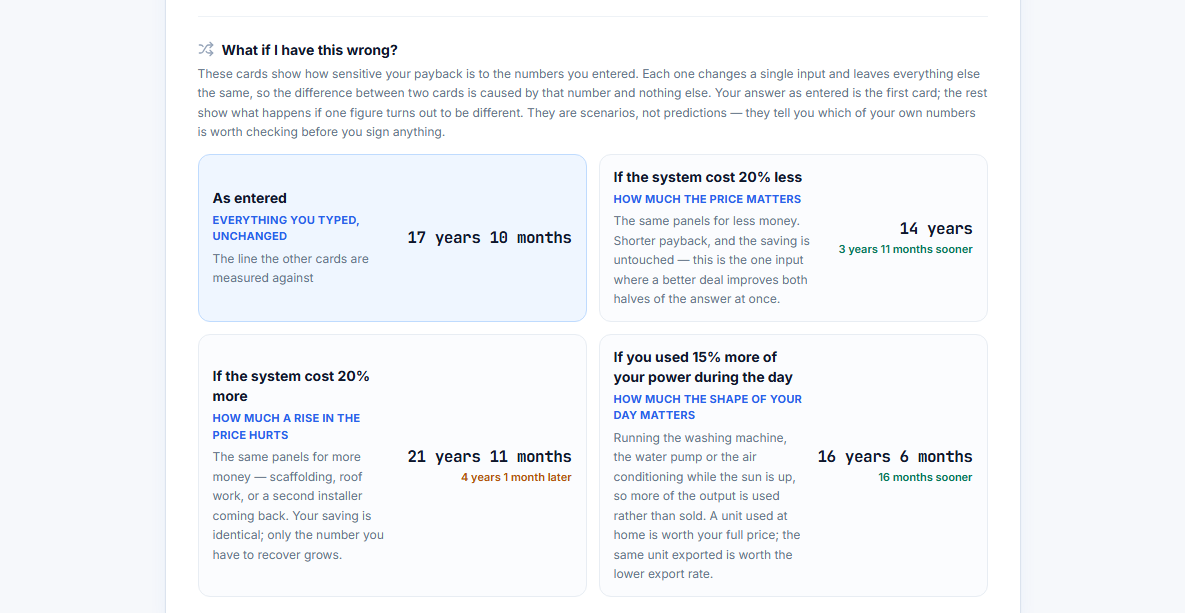
Each card says three things, in this order.
The bold line is what changed. The blue line underneath is what that tests — the question the number answers, in a few words. The grey paragraph is how to read the result, including what you would have to believe for the case to apply to you at all.
A card labelled only “20% dearer system” gives you a number and nothing to attach it to. It does not say why anyone would quote you 20% more, and it cannot tell you whether a swing of two years is an ordinary Tuesday or a reason to go shopping for a second quote. The cards now do: the dearer-system one names scaffolding, roof work or a second installer coming back, and the self-consumption one names the appliances you would shift to daytime.
Read them like this:
- A wide swing on price means a fragile answer. If 20% either way on the system price moves the payback by years, the answer lives or dies on your quote — and the quote is the one thing worth a second opinion.
- A narrow swing means the answer is robust. If everything moves it by a few months, you can stop worrying about precision.
- “If you used 15% more of it yourself” is the one you can act on. It is not a prediction about your habits; it measures how much the answer rests on the share you enter, and that share is worth measuring properly — from your own bills rather than a guess.
None of the four is a forecast. They are all the same system with a knob turned, and the only thing they establish for certain is which of your own numbers the result is most sensitive to — which is exactly the one worth checking before you sign anything.
Adding a battery
Open the battery sectionA battery does not generate a single extra unit. It moves power from the middle of the day, when you cannot use it all, to the evening, when electricity is dearest. So the entire case for one is a price gap, and the two bars under “One unit of power, two ways” show exactly how wide that gap is on your own tariff.
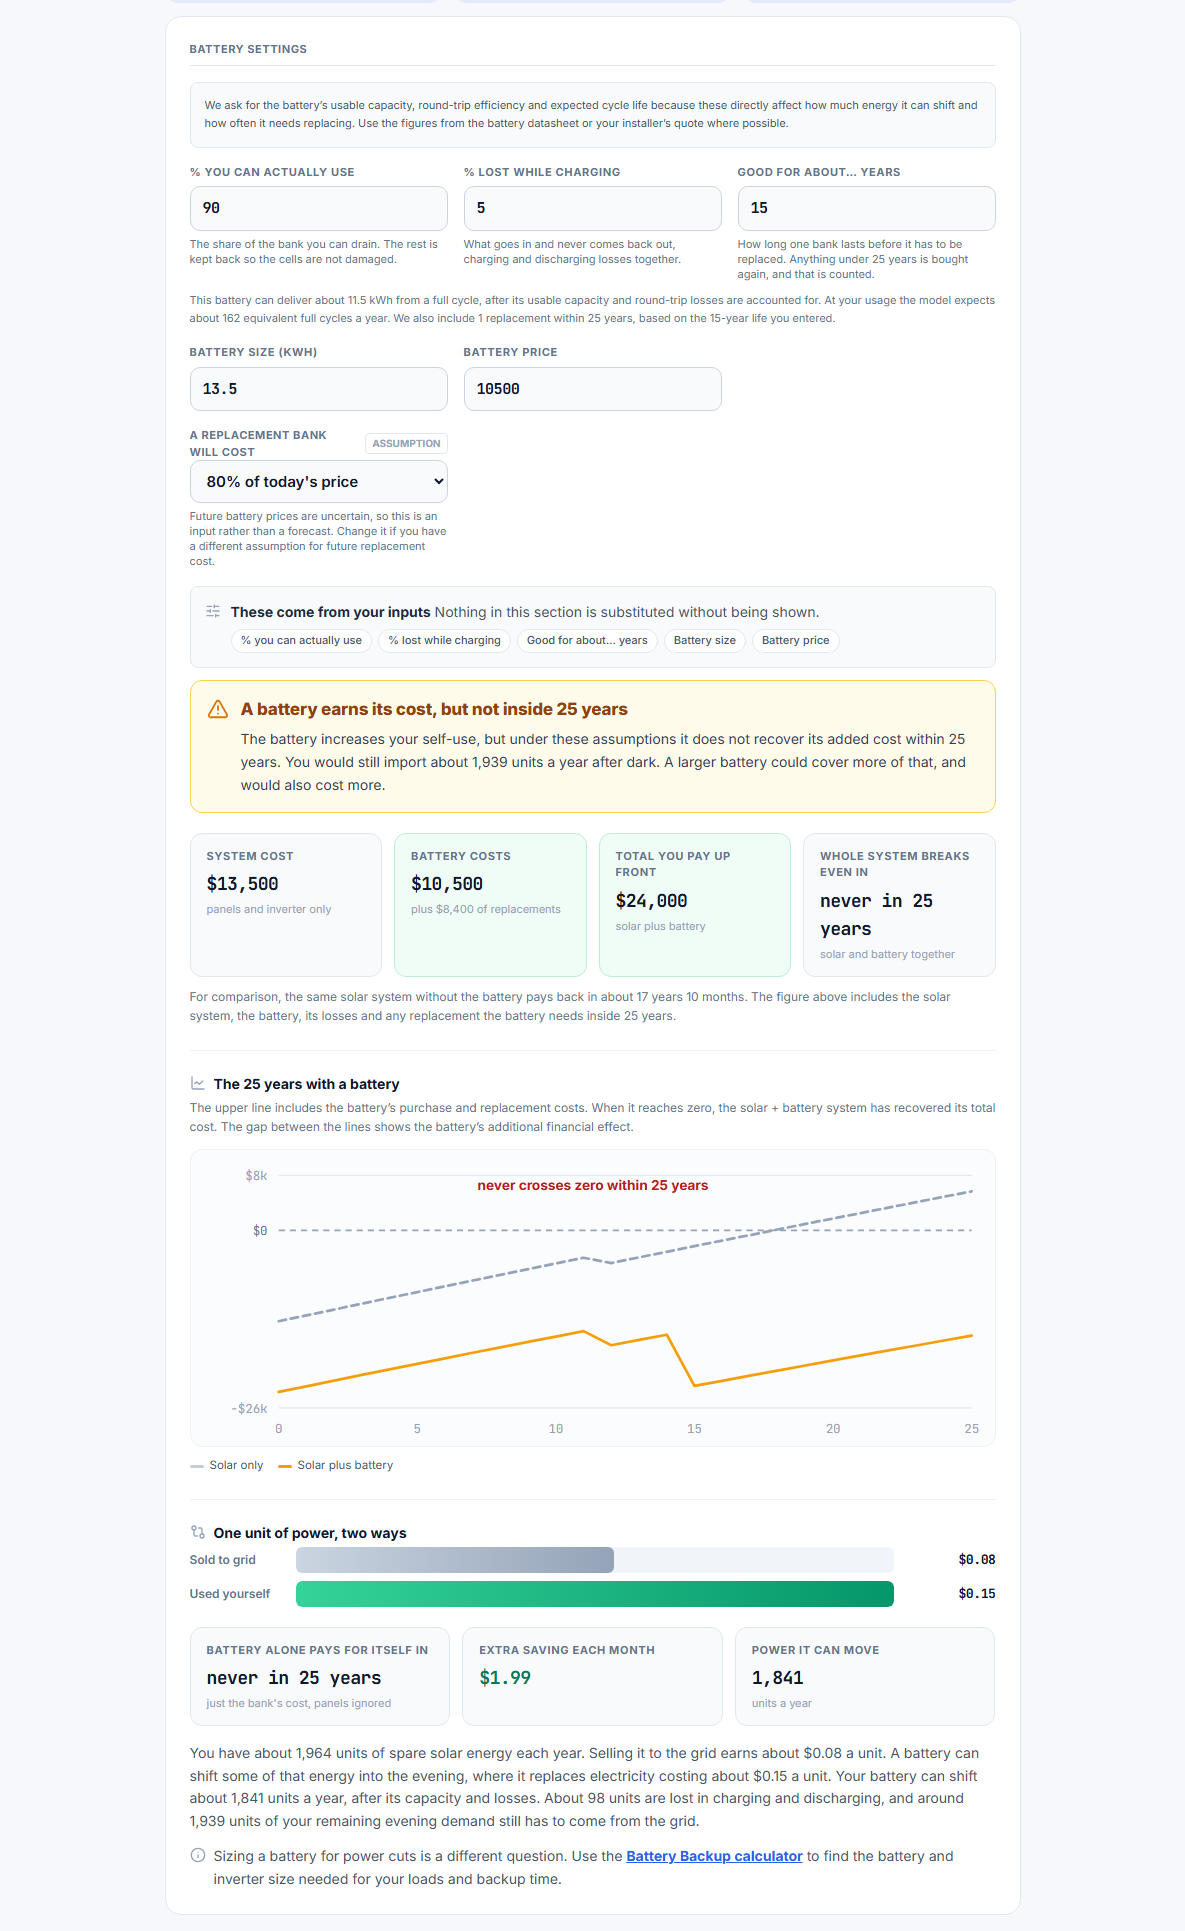
On this example the battery does not pay for itself.
The grid pays $0.08 for a spare unit. You pay $0.15 for one you use. That seven-cent gap is the whole case for a battery. This one moves 1,841 units a year, worth about $129, and costs $105 a year to run — so roughly $24 a year, against $10,500 up front plus a replacement.
Widen the gap and the same bank reads differently. So does a household that uses more power after dark.
How much a bank can actually move
Not nameplate size × 365. The page walks the twelve months and asks, in each, how much spare power the panels made and how much evening demand there was to put it into. Power charged at midday and never needed after dark is not power saved.
Two figures on the panel come out of that:
| Figure | On the 13.5 kWh example | What it tells you |
|---|---|---|
| Cycles achieved | 162 a year, not 365 | What the bank is really paid for. The other 203 days it has nothing to move. |
| Evening demand un-met | 1,939 of 3,780 units | How much night-time use still comes from the grid. A bigger bank would close it. |
Past a point, a bigger bank buys nothing.
These panels make 1,964 spare units a year. Once the bank can hold all of that, extra capacity stops moving energy:
| Bank | Price | Units moved | Cycles |
|---|---|---|---|
| 5 kWh | $3,900 | 1,165 | 273 |
| 10 kWh | $7,800 | 1,777 | 208 |
| 13.5 kWh | $10,500 | 1,841 | 162 |
| 20 kWh | $15,600 | 1,841 | 109 |
The 20 kWh bank moves the same energy as the 13.5 kWh one, costs $5,100 more, and works half as hard. The limit is the spare power, not the bank.
Mostly daytime? You need a smaller one. The same 13.5 kWh bank moves 518 units for a mostly-daytime household, 1,841 for a mixed one, 3,737 for a mostly-evening one.
The battery price goes into the total, and it changes the answer
The four figures across the top are answering four different questions, and the two payback numbers are the easiest thing on the page to confuse — so they are named for what they actually measure:
| Figure | Question it answers |
|---|---|
| System cost | What the panels and inverter alone cost. |
| Battery costs | The bank, plus every replacement its stated life forces inside 25 years. |
| Total you pay up front | The two added together — the number your installer will actually ask for. |
| Whole system breaks even in | How long panels and battery together take to pay for themselves. This is the figure the chart’s zero crossing also shows, and the note under the chart points at it for exactly that reason. |
| Battery alone pays for itself in | Whether the bank on its own earns back its own cost, with the panels ignored. A different question, and it can read “never” while the whole system breaks even in year two. |
The answer at the top of the page is deliberately not affected by any of this. It is solar alone, and it stays that way whatever you do in the battery section, so you always have a like-for-like baseline to compare against.
Every section puts its settings before its results.
Open the battery, grid or installment panel and the boxes you need are at the top, open, with the figures below them. That order is the point. A panel that shows a number first and hides the inputs in a collapsed disclosure underneath reads as though the number were a fact about your roof rather than a consequence of something you typed. You set the figures, then you read what they produce, then a banner underneath tells you how many of the boxes are yours and how many are still the page’s assumption.
You supply the battery's three numbers, not a chemistry name
There is no “type of battery” dropdown, and that is deliberate. A chemistry name only tells you which of three numbers to look up, and looking them up is where the errors come from: a bank described as 10 kWh may only be half-drainable, may lose a fifth of what goes into it, and may need replacing six times before the panels wear out. So the calculator asks for the three numbers themselves — and it puts them at the top of the section, above the results, so you set them before you read anything they produce.
| What it asks for | What it is | Where you find it |
|---|---|---|
| % you can actually use | The share of the nameplate you can drain. The rest is held back so the cells are not damaged. | Datasheet, as depth of discharge or usable capacity. Often 90% and sometimes 50%. |
| % lost while charging | What goes in and does not come back out — charging and discharging losses together. | Datasheet, as round-trip efficiency: if it says 95%, the loss is 5%. |
| Good for about… years | How long one bank lasts before it has to be replaced. | Datasheet warranty, or the installer. Anything under 25 years means buying it again. |
| A replacement bank will cost… | What the second, third and later banks are assumed to cost, as a share of today's price. Marked assumption on the field, because it is one. | Nowhere. This is the least knowable number in the whole model: it depends on lithium prices, on how many manufacturers are still around, and on whether the chemistry changes twice more first. |
That last row is why the replacement price is yours to set rather than ours. It defaults to 80% of today's price — the intuition that a bank bought in 2040 costs less than one bought today, since the technology will have moved on. But prices could equally well stay flat, or rise with demand, and at 100% the difference over a 25-year model is large enough to change the verdict. 60%, 80% and 100% are all offered, each stated in words rather than as a percentage you have to interpret, and each charged to the year the replacement actually happens rather than averaged into a single total.
The panel then shows its own arithmetic back at you, so you can check it against the sheet: a 10 kWh bank that is 90% usable and loses 5% is 8.6 kWh per cycle, and cycled once a day that is about 3,100 units a year. It also states how many replacements the life you gave forces inside 25 years — one for a 15-year bank, six for a 4-year one, none at 25 years or more — and each is charged to the year it happens, not averaged away.
The one thing the model does assume is that the bank is cycled once a day. That is a convention of how storage is normally run rather than a property of your bank, and it is stated in the panel rather than buried. It sets how much a bank can move in a year: the usable size, times the round trip, times 365.
All five battery settings start empty, and the panel shows nothing at all until they are filled in.
Usable percentage, loss, life, size and price are all unset when you first open the section. Until every one of them is entered, the battery panel shows no figures, no chart and no verdict — just a note saying what is still needed. A battery priced against a guess about its own behaviour produces a confident number you cannot check, which is the one thing this page exists to avoid.
The grid and installment panels are gated the same way. The grid panel needs one number — what your utility pays for a unit you send back — and the installment panel needs your loan terms. Neither will fall back to a guess.
The setting that changes the answer most is when you use power. Someone whose use is concentrated after sunset gets far more from a bank than someone whose use is already daytime, because the stored power has somewhere to go. The page says so in those words rather than leaving a control that appears to do nothing.
None of this covers keeping the lights on during an outage, which is a sizing question rather than a money question. The Battery Backup Calculator handles that, and this page links to it.
Selling spare power to the grid
Open the grid sectionIf you do not consume all your own generation, the surplus goes to the grid and you are paid for it. The page leads with the share you will not use, then the two prices, then the ratio.
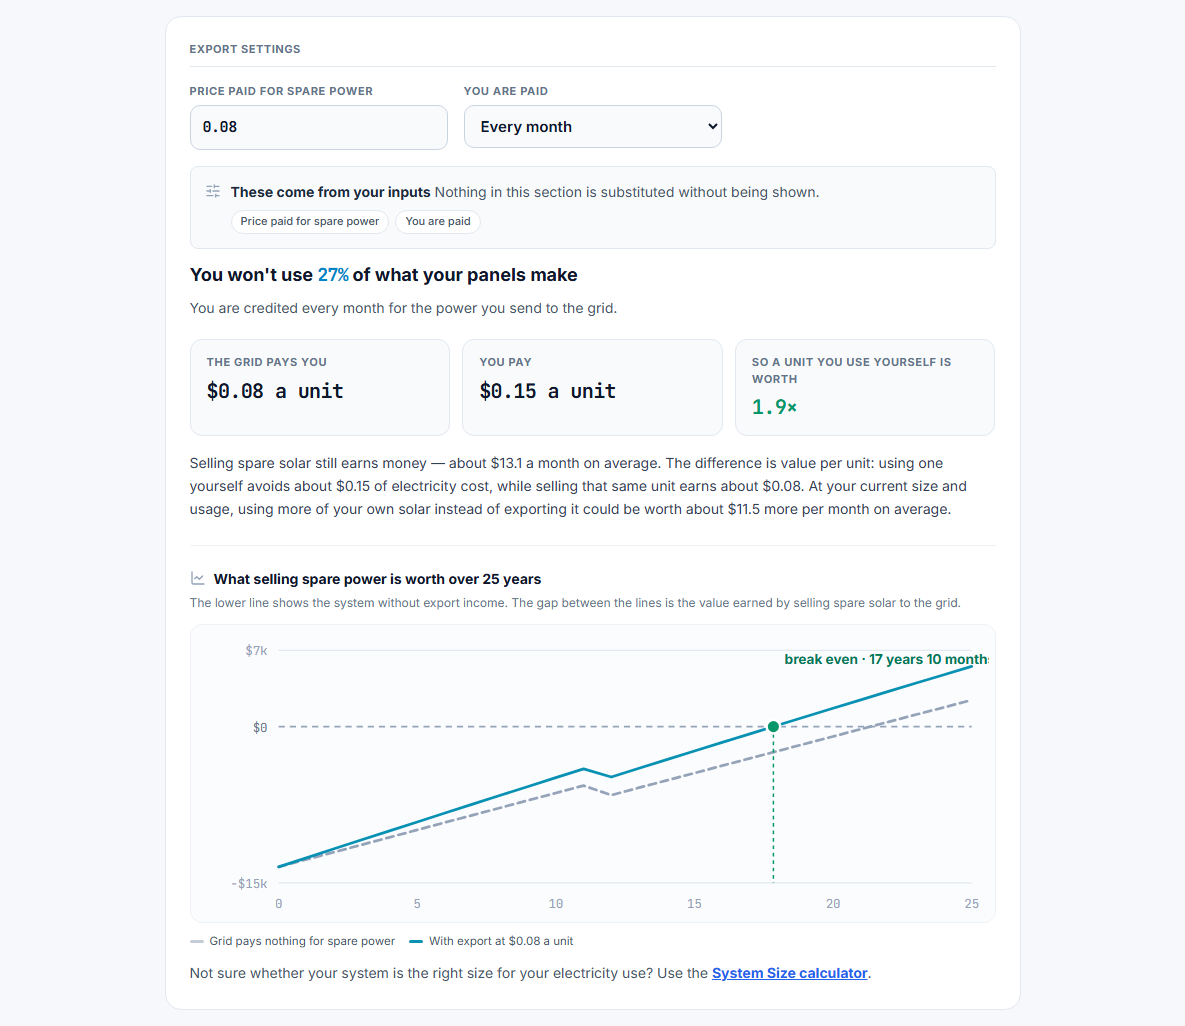
The ratio is the whole point of this section.
A unit you use yourself avoids the full price you would otherwise pay. The same unit sold earns only what your utility pays for exports, which is usually much less. If the ratio reads 1.9×, one unit consumed at home is worth 1.9 units sold. The gap between the two bars is money that already exists but is being collected at the lower rate.
Two settings are unset until you fill them in: the price paid for spare power and whether you are paid monthly or once a year. The second one is easy to overlook and it matters if your utility settles annually — a bad export month is not credited until the next statement. The banner above the figures tells you how many of the two settings are yours.
The third thing that used to sit here — a percentage of your own generation you use yourself — is gone from this section, and deliberately so. It asked for the same fact as when do you use power but measured it differently, and answering one told you nothing about the other. It now lives once, with the primary inputs, as a question about the shape of your day rather than about your solar.
Until you enter an export price, this page credits you with nothing for spare power.
That is a deliberate choice, and it is worth being explicit about. What a utility pays for an exported unit is set by your country, your utility and sometimes your installer — it can be a third of what you pay to import, it can be the same, and in some places you are not allowed to sell at all. Any figure this page invented for it would be a guess sitting directly under the headline answer, and it would shorten the payback whether or not it were true.
So unsold surplus is worth nothing until you say what it is worth. Leave the field blank and the top answer quietly assumes you get nothing; enter your real rate and every figure on the page, including the headline, moves to include it. Either way the number you read is one you supplied.
If your array is larger than your household can absorb, the page says a bigger one would not add anything to the figures — and points at storage as the only thing that would change what is left over after dark. It does not pretend the surplus is gone, because it is not: on an oversized array the panels cover all the daylight they can be used for, and every night-time unit still comes from the grid.
Paying by EMI
Open the EMI sectionFinancing changes when you pay and how much more you pay in total. It does not change the panels, and it cannot make a system that does not pay back into one that does. This section shows both halves of that.
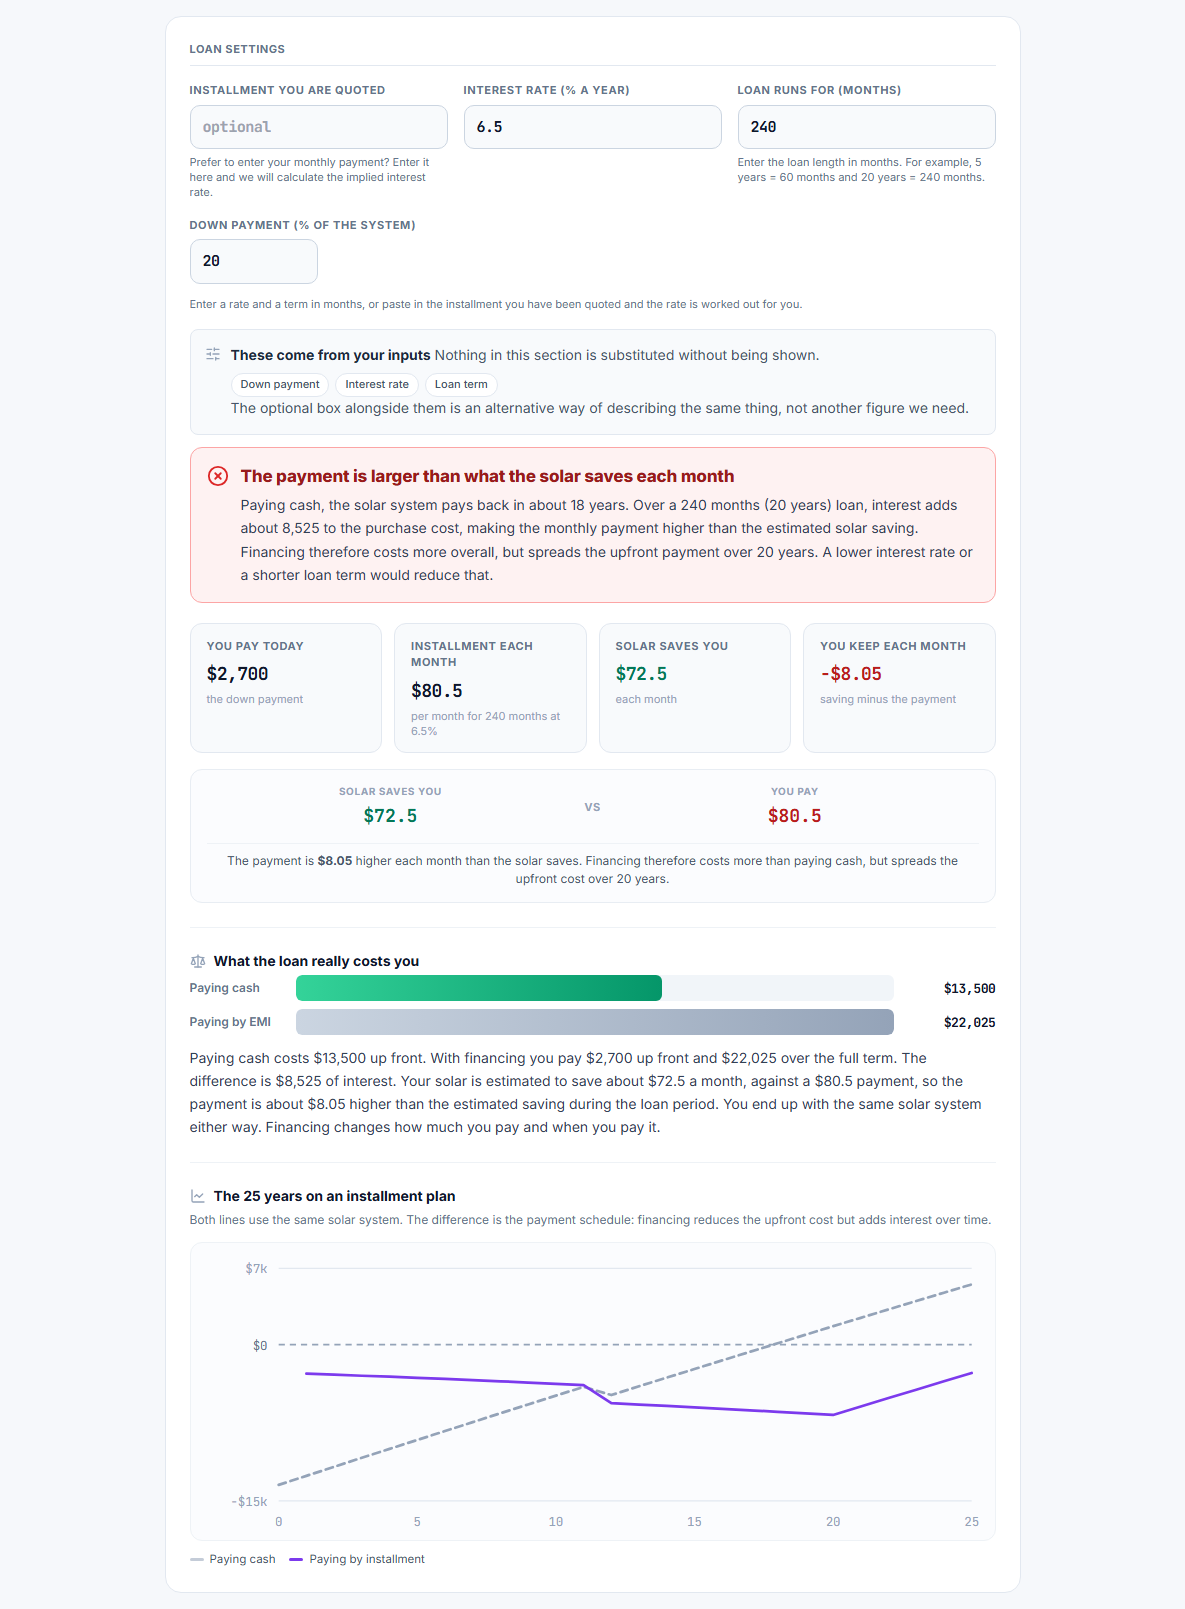
Put your installment in, not a rate
Lenders quote a monthly payment, not a rate. The loan settings accept either: enter the installment you have been quoted and the rate that makes the loan close is solved for you and shown back, because a quote is the number you actually have and the rate is the one you are guessing at.
The term is entered in months, because that is how lenders quote it.
A five-year loan is 60, a twenty-year loan is 240. Years hide the cases that matter: a 30-month loan and a 30-year loan are three very different promises, and both would be typed as “30”. The section states the term in both units in the text, so there is never a moment of having to convert it yourself to check you typed it right.
The rule that decides this section
The loan is ahead for as long as the monthly payment is smaller than the monthly saving. Put those two numbers side by side and you have your answer without any other figure.
Two things move the payment down: a lower rate and a shorter term. A longer term also pushes more of the cost into interest, so it lowers the payment while raising the total. Neither one is decisive on its own — both have to be checked against the saving beside them. A 30-year loan at 7% can still cost more a month than the panels earn, and a short loan at 2% can be comfortably under it.
The cash-versus-loan bar makes the cost of borrowing visible: cash is the shorter bar, the loan is the longer one, and the difference is the interest. On the 25-year chart, the loan line starts above the cash line because less has been paid out of your pocket so far, and the accumulated interest pulls it below later. Where the two lines cross is the point.
Down payment, rate, term and installment are all unset by default. A subsidised solar loan and a commercial one can differ by more than the entire system price, so the default is a placeholder for your own terms, not a prediction.
Which number decides it, and which are forecasts
The page deliberately shows no score, no grade, and no ranking against other investments, because none of those can be supported by a calculation. What it shows instead can be sorted into two groups, and keeping them apart is the whole skill of reading it. The heading icon used to be a star, which is exactly the sort of shorthand the page refuses to use elsewhere.
Arithmetic you can check yourself
These follow from the numbers you supplied and the tariff you are on. If a competitor quotes a lower price or you use more power at night, they move — and you can reproduce each one with a calculator.
- Your bill before and after, and the percentage drop
- The unit price you keep for each unit used at home versus each unit sold
- The monthly EMI and the interest total
- How much of your generation you use on site
Estimates about the future, and about your house
These depend on assumptions the calculator states and cannot verify. Treat them as planning figures, and weight them by how much each one moves the answer in “What if I have this wrong?”
- Payback period. Built on a national average yield rather than a survey of your roof, a 0.5% annual wear rate, 0.5% a year for cleaning, and one inverter replacement in year 12 — unless you enter your own measured output, which replaces the average outright.
- 25-year totals. Same assumptions, compounded over a quarter of a century.
- Your daytime share. How much of your consumption happens while the sun is up — the single most uncertain input on the page, and the one the sensitivity cards move most. The page names it on the answer itself, and says plainly whether it is yours or our default. It is no longer a flat percentage of what the panels make: it is walked month by month, because your panels cannot usefully cover more than you use while the sun is up, and a summer surplus cannot cover a winter shortfall. See when do you use power.
- Battery figures. Nothing is shown at all until all five of its own numbers are entered, because a bank priced against a guess about its own behaviour produces a figure you cannot check. What a replacement bank will cost is a sixth, and it is the least knowable number in the model — so it is yours to set rather than ours.
- Anything past year one. Assumes your consumption, your roof and your tariff behave the same way for 25 years.
If you remember one thing: the payback period is the least important number on the page. It is sensitive to every estimate at once, and it is the figure most often quoted back at you by a seller. The two that actually decide the question are what the system costs you, and what you pay for electricity. Settle those two and the rest follows; leave them open and no amount of precision elsewhere will help.
If a figure looks wrong, or will not move
Back to the inputsThe calculator runs every figure through a consistency check, because all the arithmetic can be correct while the inputs cannot all be true. A system price in rupees sitting next to a tariff in dollars produces a tidy, confident, meaningless answer — so when that happens the page names the field, gives a plausible range, and says what to change.
| What you see | What it means | What to do |
|---|---|---|
| A red panel naming a field | That field cannot be right alongside the others. Usual causes: mixed currencies, or a per-unit price typed where a monthly amount belongs. | Set the currency selector first, then re-read the per-unit price. The panel names the exact field and the range to aim for. |
| “About N per kW installed” | System price divided by system size, converted to a common currency. Real installs run from roughly $250/kW in a subsidised market to $5,000/kW for a premium one. | Check the price is for the whole installed system, in the same currency as the unit rate. |
| Your system is bigger than you use | The array makes more power than the household can consume, so the extra is exported at whatever your utility pays rather than displacing a purchase at your own rate. | Enter units you use a year and the note under the inputs will say how much of the output is spare. The battery and export sections price the two things that can be done about it. |
| A bigger bank moves the same energy as a smaller one | Your panels do not make enough spare power to fill the bigger bank, so the extra capacity has nothing to do. | Nothing to fix in the bank. Compare the cycles a year figure instead: a larger bank working less hard is being paid for as though it were not. The ceiling is the spare power and the evening demand, not the nameplate. |
| The answer changed a lot and you only touched one thing | You probably changed when do you use power. On the worked example that is worth six and a half years of payback. | Nothing is wrong. It is the largest single lever on the page, and it is the one most calculators leave out. Check which answer the assumptions list says was used. |
| “Add your units a year above” | The page cannot price your bill before and after the system, because nothing told it what you use. | Enter your units a year. It is optional for a payback, and required for anything about your bill. |
| The cost tile is tagged “illustrative” | You accepted a blended average rather than entering a real quote, so the price is ours and not yours. | Type a real quote over the top and the tag, the amber note and the installer-card warning all disappear at once. Until you do, the payback is only the shape of the answer. |
| Profit after payback is showing as “–” | There is no figure to show, because the system does not repay you inside 25 years. | Nothing to fix. The 25-year total benefit beside it still tells you what the panels do earn, and the page says plainly that it is less than they cost. |
| Bill drop of 100% | Your array covers all your daytime import. Not a free lunch — night-time use still comes from the grid. | Read the badge as “daytime import falls”. Open the battery section to see what storage changes. |
| Your bill drop never reaches 100% | Expected, and usually for one of two honest reasons: you use some power after dark, or the panels do not make enough in the darker months to cover even your daytime use. | Nothing to fix. It took a full annual average to hide both of those. If you genuinely use no power at all while the sun is up, type 0 into the daytime-share field and the page will say so plainly. |
| A panel shows only dashes | It is missing a number only you can supply, so it has calculated nothing rather than guessed. | Battery needs five: usable %, % lost charging, life, size and price. The grid panel needs your export price. The installment panel needs your loan terms, or the monthly payment you were quoted. |
| A battery payback beyond 25 years | It is shown as “never in 25 years” rather than the absurd figure, because a bank cannot outlive the model. | Compare the price against the two prices in the same panel. If they are close together there is no gap to exploit, and no battery price makes it work. |
| The payback looks too good | Usually the system is large relative to the bill, or an export price has been entered that your utility may not actually pay. | Check the size note: it shows the array it chose and the units a year that makes. Then check what you pay per unit, which every figure on the page is derived from. |
Take it to your installer
Under Take this to your installer, near the bottom of the results, the page puts the headline figures on one card: the system size, what it makes, the share used on site, the cost, your bill before and after, the monthly saving and the payback. Screenshot that card, or read it off the screen — it is the same set of numbers in the same order every time, so it can be compared against a second quote on the same footing.
Two rows on that card are conditional. If you entered your units a year it also shows what you use, so the installer can size against something real. And if you are still on an illustrative estimate, the cost row is relabelled Illustrative cost, two more rows appear for the profit after payback and the 25-year total benefit, and a warning appears underneath telling you not to show the card as a specification. That is deliberate: the card is the one artefact that leaves the page, and the one most likely to be read as something it is not.
Put your own numbers in
The calculator keeps your last session, so you can come back to it. If you would rather start from a fresh answer, open it below and enter your system size, your quote and the price you pay per unit.
The full calculator map
Every tool on the site, and what each one is for. Only this page carries the full list.
Every figure here is a planning estimate, not a quote or a bankable return. The calculator uses a
sunlight band for your latitude rather than a survey of your roof, a fixed rate of panel wear, a
typical cleaning and repair cost, and one inverter replacement. Real output depends on your roof
angle, shading, dust and the panels you buy. Use this to compare options against each other, then
get a written quote before you commit. This guide describes how the calculator works; it does not
recommend a course of action.
About·Contact·Terms·Disclaimer·Methodology·Privacy Policy
·
Cookie Policy